Assignment 10
Exploring Parametric Equations and Curves
Nicolina Scarpelli
A curve in the plane is said to be parameterized if the set of coordinates on the curve (x , y) are represented as functions of a variable t, namely x = f (t) and y = g (t). These two equations are usually called the parametric equations of a curve. The variable t is called a parameter. In many applications, parametric equations are extremely useful in describing the movement of a point along a curve, so in many cases we think of x and y "varying with time t".
Let's begin our investigation by exploring the parametric equations x = a cos(t) and y = b sin(t) for 0 ≤ t ≤ 2π while varying the a and b values. We will begin with a = b = 1.
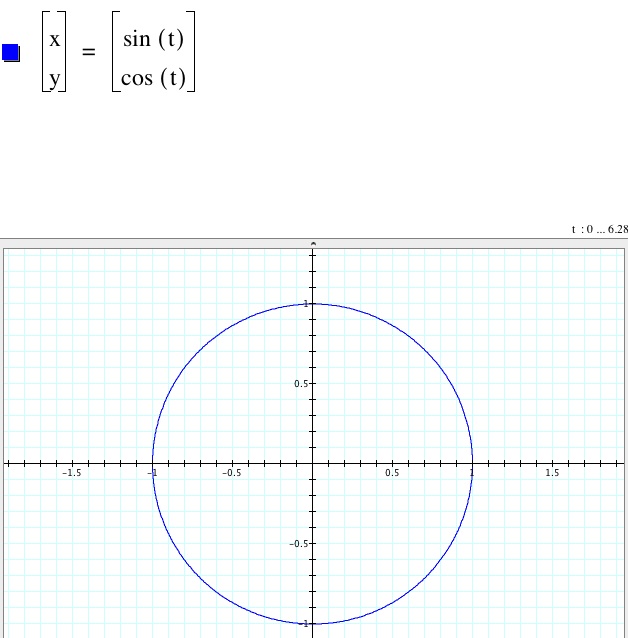
Now, let's switch x and y to see what happens to the graph. So let x = a sin(t) and y = b cos(t). How do you think the graph will be different?
Observe that the two graphs above are the same graphs because it is essentially a reflection of each other over the line y = x.
Now, let's observe what happens when a = b = 2. Observe the graph below.
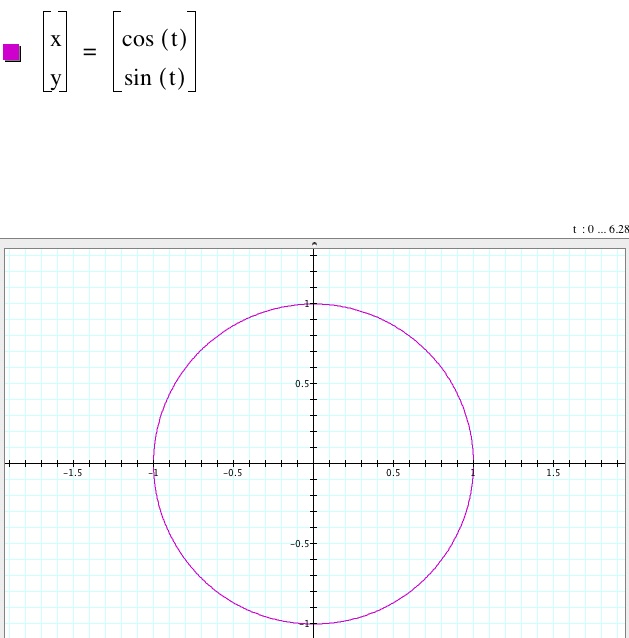
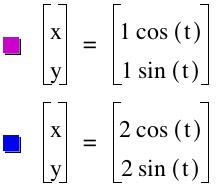
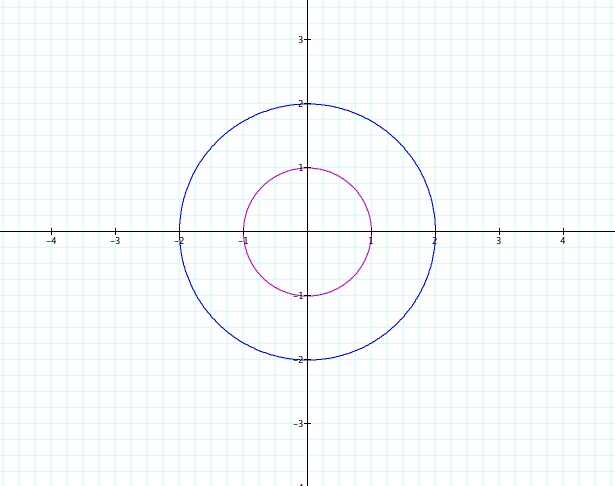
Notice from the graphs above when a = b, the paramaterization of x and y is a circle centered at the origin (0,0) with radius equal to a. When a = b = 1, we have a graph of the unit circle. Since the domain of t is between 0 and 2π (approximately 6.28) or 360 degrees, the graph starts at t = 0, the point (a,0) or in this case (1,0), and moves in the counterclockwise direction around the origin to create a full circle that ends at t =2π, which is also the point (a,0) or in this case (1,0). The same holds for when a = b = 2 except the circle begins at t = 0, the point (2,0), and ends at t = 2π, also the point (2,0).
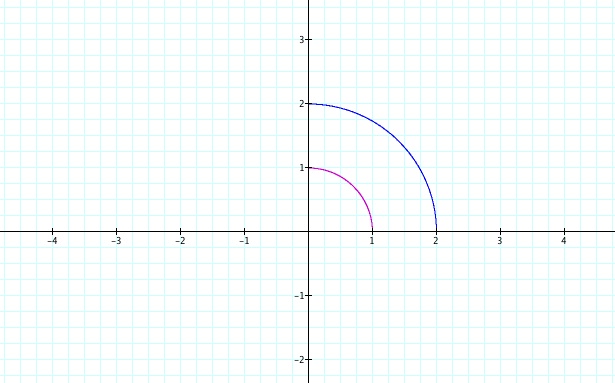
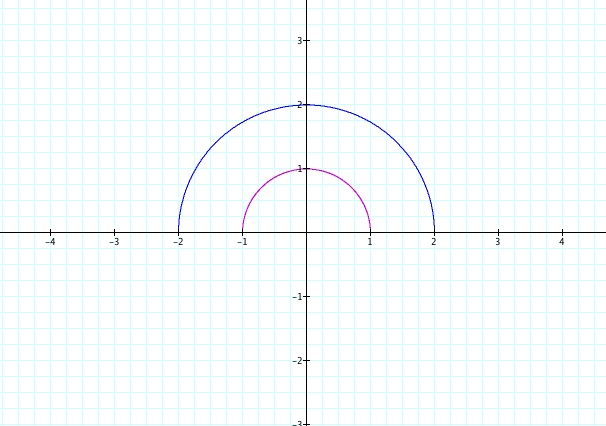
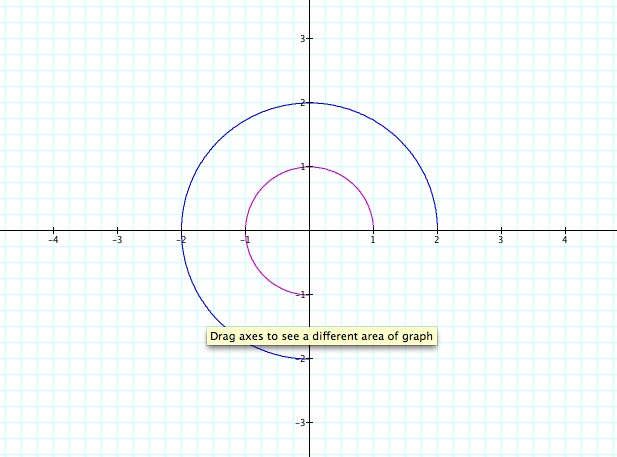
To further investigate, hypothesize what will happen if your t - values range from 0 to π instead of 0 to 2π. How will your graph be different than the graph above? What if t = (0, π/2) or t = (0, 3π /2)? Observe the graphs below.
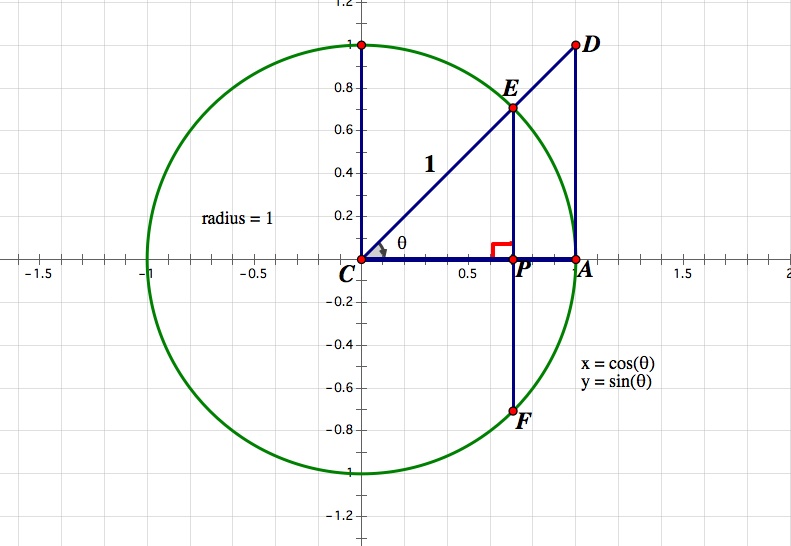
The graph to the far left is the graph of the parametrics equations with t ranging from 0 to π /2 or 90 degrees, the middle graph is the graph of the parametric equations with t ranging from 0 to π or 180 degrees, and the far right graph is the graph of the parametric equations with t ranging from 0 to 3π/2 or 270 degrees. Focusing on these properties, we can extract an important trigonometric identity from the unit circle above. Observe the unit circle below that I created using Geometer's Sketchpad.
Using the right triangle CPE in the above diagram, CP= cos(θ), EP = sin(θ) and CE = 1 (the radius of the circle. Thus, by the Pythagorean Theorem CP2 + EP2 = CE2. Substituting for CP, EP, and CE we get, cos2(θ) + sin2 (θ) = 12. We will use this formula later on in our investigation.
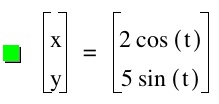
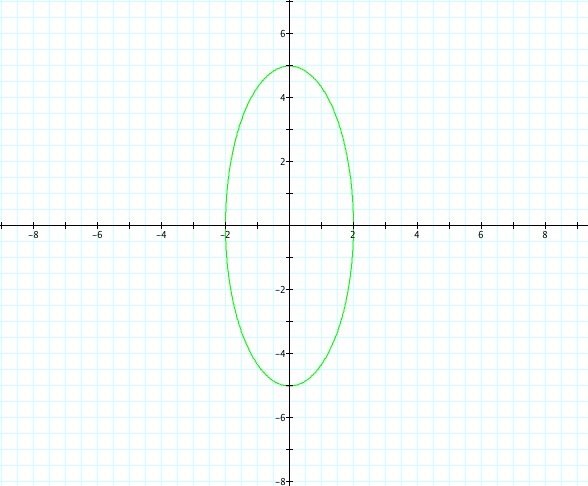
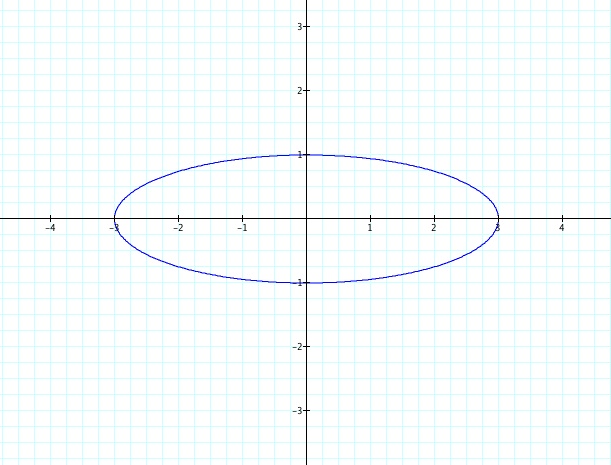
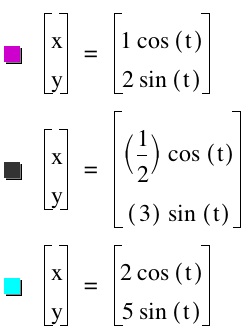
Now, let's examine what happens when a < b. Let's begin by setting a = 2, and b = 5.
Observe the graph above. When a < b the graph no longer takes the shape of a circle. We now have a graph that draws an ellipse parametrically centered around the origin. Our t - value still ranges from 0 to 2π. As you can see from the graph, this ellipse has a vertical major axis along the y - axis, x- intercepts at (-a,0) and (a,0) or in this case (-2,0) and (2,0), and y - intercepts at (0,-b) and (0,b) or in this case (0,-5) and (0,5). The equation of an ellipse in standard form is x2/a2 + y2/b2 = 1. Thus, to find the equation for this ellipse in standard form, we must solve the equation x = a cos(t) for cos(t) and solve the equation y = bsin(t) for sin(t) in order to use our trigonometric identity we established above. We find that cos(t) = x/a and sin(t) = y / b. Substituting those values into the trigonometric identity cos2(t) + sin2(t) = 1, we obtain the equation (x/a)2 + (y/b)2 = 1. This is in fact the equation of an ellipse in standard form centered at the origin (0,0) with a vertical major axis and vertices at (0,-b) and (0,b). This ellipse has a vertical major axis because the b2 value is greater than the a2 value and b2 is the denominator under the y. In our case above, we have a = 2 and b = 5, thus the equation of this ellipse in standard form is (x/2)2 + (y/5)2 = 1 which simplifies to (x2/4) + (y2/25) = 1. 25 is obviously greater than 4 and since 25 is under the y, the ellipse has the y- axis as its major axis.
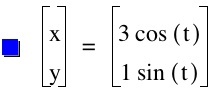
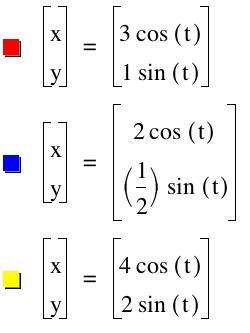
Now, let's examine what happens to the graph when a > b. Let's set a = 3 and b = 1. Observe the graph below.
As you can see from the graph above, when a > b we also have parameterization of an ellipse except this time the ellipse has a horizontal major axis instead of a vertical major axis. We can use the pythagorean trigonometric identity once again to find the equation of this ellipse in standard form. Solve for cos (t) in the equation x = acos(t) and solve for y in the equation y = bsin(t) to get cos(t) = x/a and sin(t) = y/b. Substitute the values into the trigonometric identity cos2(t) + sin2(t) = 1 to obtain the equation (x/a)2+ (y/b)2 = 1. Thus, in standard form, the equation of this ellipse is (x2/a2) + (y2/b2) = 1. Above, we have a = 3, and b = 1. Substituting these values in for a and b into the equation gives us a new equation x2/32 + y2/12 = 1 which simplifies to x2/9 + y2/1 = 1. Since a2 > b2 and a2 is the denominator of x2 this determines that the ellipse has the x-axis as its major axis. Since the major axis is horizontal, the vertices of the ellipse will be located on the x-axis at the points (-a,0) and (a,0) or (-3,0) and (3,0). The y-intercepts are (0,-b) and (0,b) or (0,-1) and (0,1).
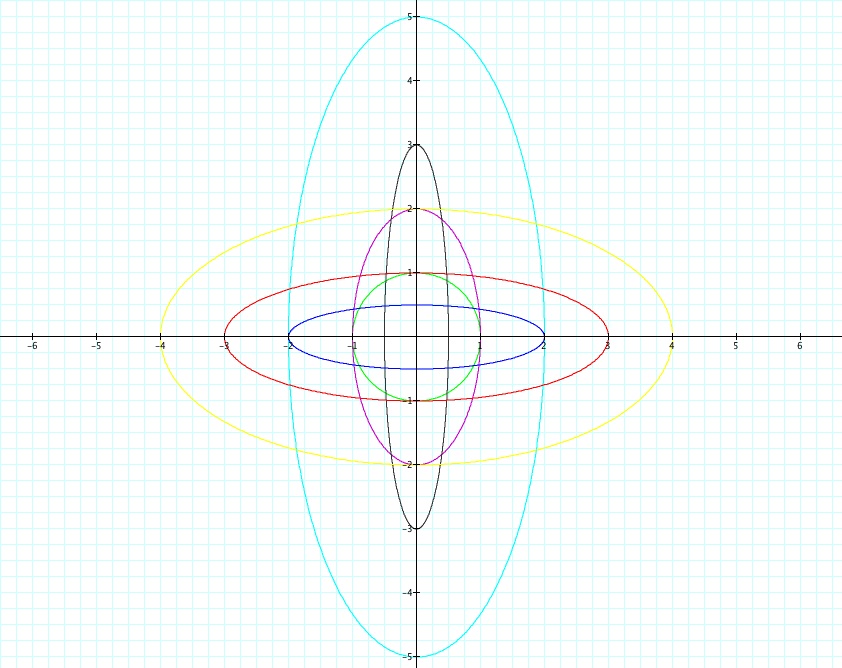
From the two investigations above, you may be able to tell that the equations for the ellipses formed are very alike. However, when a > b, meaning a2 > b2, and the larger value a2 is the denonminator of the x2 term, the major axis of the ellipse will be horizontal along the x-axis.When a < b, meaning a2 < b2, and the larger value b2 is the denominator of the y2 term, the major axis of the ellipse will be vertical along the y - axis. Therefore, the a and b values determine the major axis of an ellipse.
Observe the graph below that shows many graphs on the same set of axes and observe the changes when a < b and when a > b.
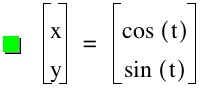
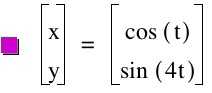
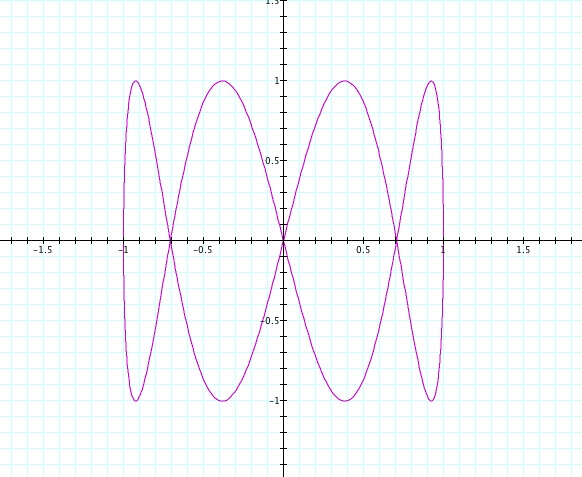
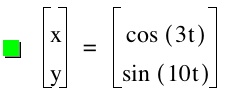
For further investigation, let's explore the parametric equations x = cos(at) and y = sin(at) for various values of a and b. Can you predict what kind of graphs will be formed when a = b, when a >b, and when a < b? Observe the graphs and animations below.
When a = b, the graph is a circle.
View the animation below. The t-values range from 0 to 2π (6.28)
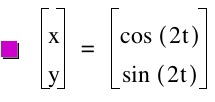
Now, let's observe what happens when a > b.
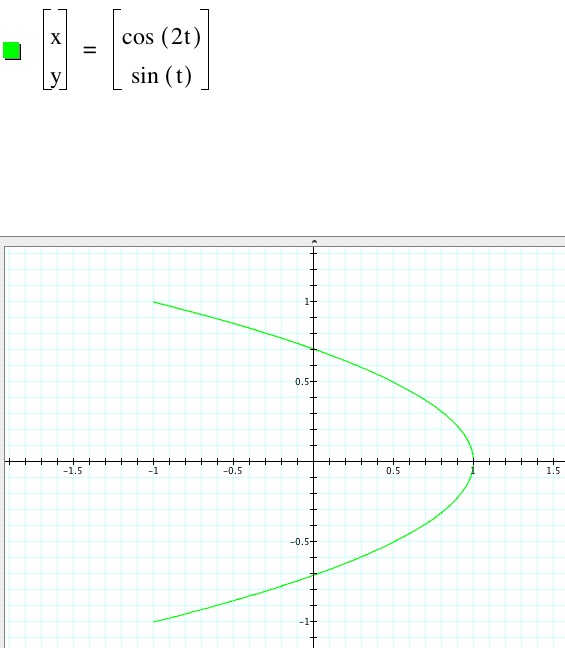
Observe when a = 2 and b = 1, a sideways parabola is formed. Why is this?
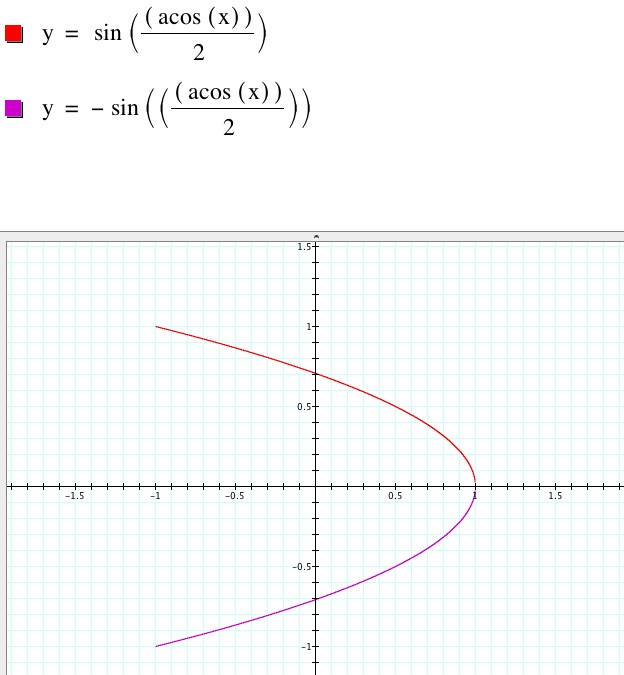
If you take the function y = sin(t) you can see that it equals the function y = sin(12t). Now, solve for t in the function x = cos (2t) you get t = (cos-1(x))/2. Then if you substitute this value of t into the y function y = sin(t) you get a new function y = sin2((cos-1(x))/2). To solve for y, you must take the square root of this function which leaves you with two values y = sin(cos-1(x))/2) and y = - sin(cos-1(x))/2). These two graphs make up the parabola shown above. Observe the graph below, "acos" stands for arc(cos) which is the inverse of the cosine function.
Now, let's observe more graphs where a > b.
From these graphs, we can see that the period is increasing while the value of a increases. In addition, we can see that the cosine function is symmetric about the y - axis. This leads to a very important concept of the cosine function being an even function. cos (x) is an even function because cos (-x) = cos (x). Observe the animation below to see how the period of the graphs of the cosine function change when the parameter n gets smaller and larger. Why does the graph seem to be moving around the x-axis?
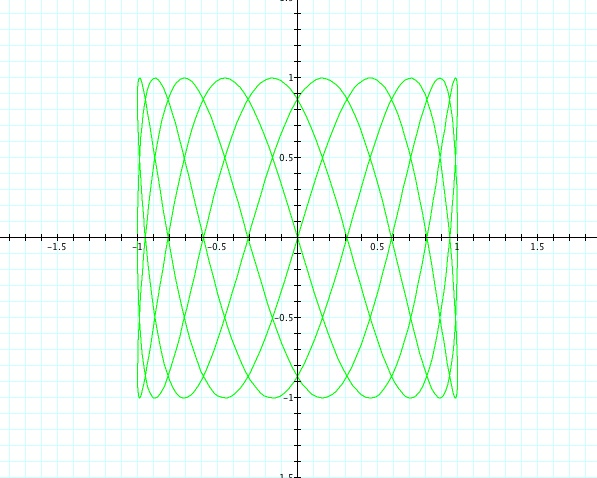
Next, let's observe what happens when a < b. Any hypotheses on what the graph will look like?
sin(t)circle.jpg)
.jpg)
.jpg)
.jpg)
graph.jpg)
.jpg)
.jpg)
.jpg)
As you can see from the graphs, when a < b , it seems that the period of the sine function is getting larger. The sine function is an odd function because sin(-x) = -sin(x), and it's graph is symmetric to the origin. Observe the animation below when a is held constant and equal to 1, and the parameter n ranges from -10 to 10. Why does the graph seem to be moving around the origin in such a way?
graph.jpg)
For further investigation, try exploring the tangents of parametric curves, finding the area under parametric curves, and examine different parametric curves such as x = t2 + t and y = 2t - 1. Also, you can have your students explore the path of a particle given by a set of parametric equations, and have them describe the path of the particle, and give the range of t-values for which the path will be traced out exactly once.